The Koeleplekkenchecker
City of Amsterdam

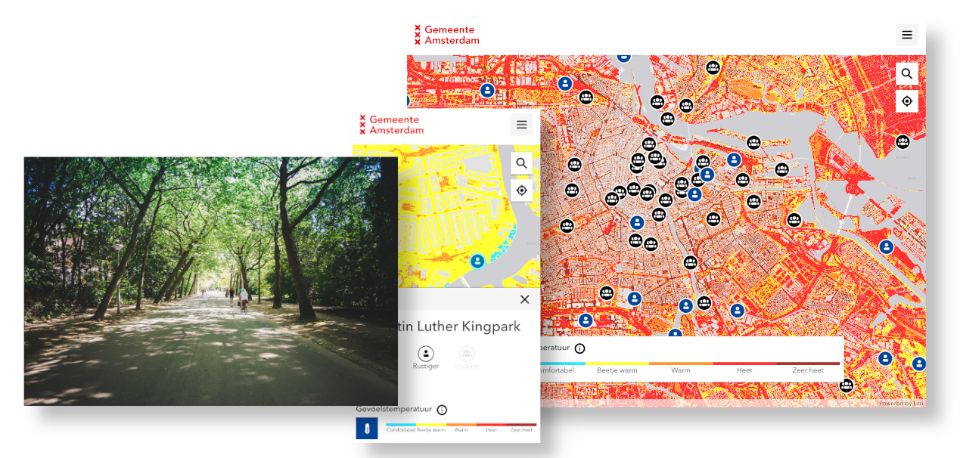
A heatwave is no longer a rare occurrence. For some, it means enjoyment – for others, an additional challenge. During extreme heat in the city, where can you find a place to stay cool? In 2020, in collaboration with the City of Amsterdam, Witteveen+Bos developed the Koeleplekkenchecker, an interactive map showing the perceived temperature in the city as well as where you can go to cool off.
Data science for heat stress
To make the calculations required for maps such as this, Witteveen+Bos developed an algorithm – based on a method developed by Wageningen University & Research (WUR) – which validates the results using measurement data. Due to the algorithm’s clever design, an up-to-date heat map can be produced for the Koeleplekkenchecker every hour.

Perceived temperature
The Koeleplekkenchecker keeps track of perceived temperature measurements. Perceived temperature is different to air temperature. The latter is measured at a weather station, whereas perceived temperature indicates how hot a person feels in a particular situation. In some places, the perceived temperature can become quite high. If the measured air temperature is 30 °C, for example, it could feel like more than 40 °C in the sun and out of the wind. Owing to their built-up nature and relatively few green spaces, cities become hotter than areas outside them.
Crowds
The map also shows how crowded an area is – due to corona, an important consideration at the time of its launch.

Amsterdam and heat
Amsterdam and the local municipal health service pay extra attention to vulnerable groups when temperatures are extremely high – in particular, the elderly and young children. Information is provided to residents and organisations such as crèches and nursing homes for the elderly. This includes tips on how to deal with the heat and how to cool yourself, as well as advice on using the online map to find cool areas in the city.
This map is the result of a collaboration between the City of Amsterdam, Witteveen+Bos, CLEVER°FRANKE, and the Amsterdam Institute for Advanced Metropolitan Solutions (AMS Institute). Using an algorithm previously developed by Wageningen University & Research (WUR) and Witteveen+Bos, it was possible to record the current (real-time) perceived temperature.
The Heat Stress Map
Both in our living and working environments, heat is a growing problem. The Heat Stress Map displays the physiological equivalent temperature (PET), or ‘perceived temperature’.


More information?

Anna is committed to creating healthy and climate-adaptive cities using digital tooling such as the Heat Stress Map.