Water Demand Forecasting Tool
Fresh water scarcity is a growing problem for water managers at Rijkswaterstaat and the water authorities. The Water Demand Forecasting Tool makes it easier to anticipate on supply and demand. Using expected levels of precipitation and evaporation, the tool forecasts the fresh water demand on surface water up to six weeks in advance.
Applied by Rijkswaterstaat and ten water authorities
Deployable at any location
The Water Demand Forecasting Tool was first used in the catchment area around the IJsselmeer, under assignment to Rijkswaterstaat and ten water authorities. It is now also being used in the Volkerak-Zoommeer catchment area.
The models were developed using the historical measurements and forecasts of the European Centre for Medium-Range Weather Forecasts (ECMWF). These are fed with local data, making the tool useful at any location where there is fresh water scarcity, be it regular or occasional in nature. The water demand models were calculated using historical measurements for certain periods of the year.
%20(1)42.png)
Ordered list of priorities
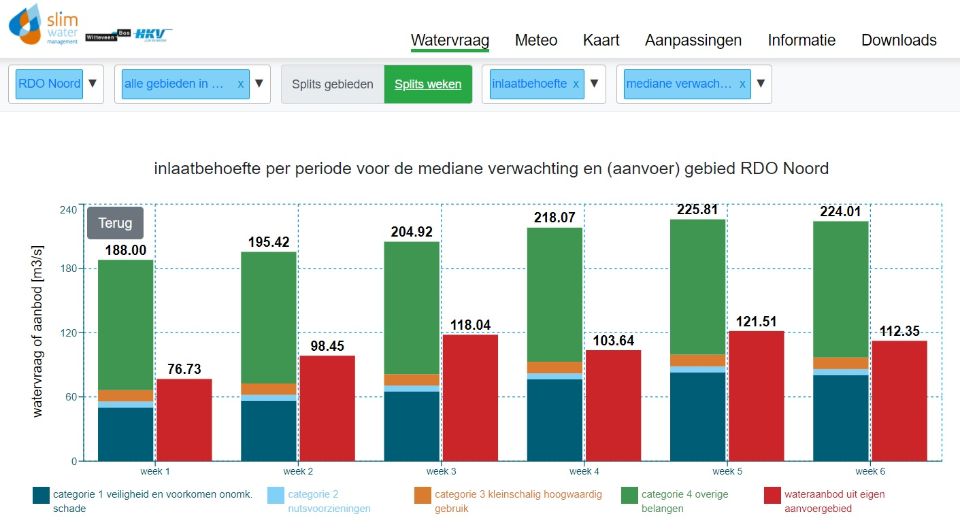
In the event of drought or low water levels, choices need to be made regarding how to distribute the available water. To help make these decisions, water authorities employ an ordered list of four priorities:
- Water safety and the prevention of irreversible damage;
- Public utilities;
- Small-scale, high-value use;
- Other needs.
Making timely and considered choices
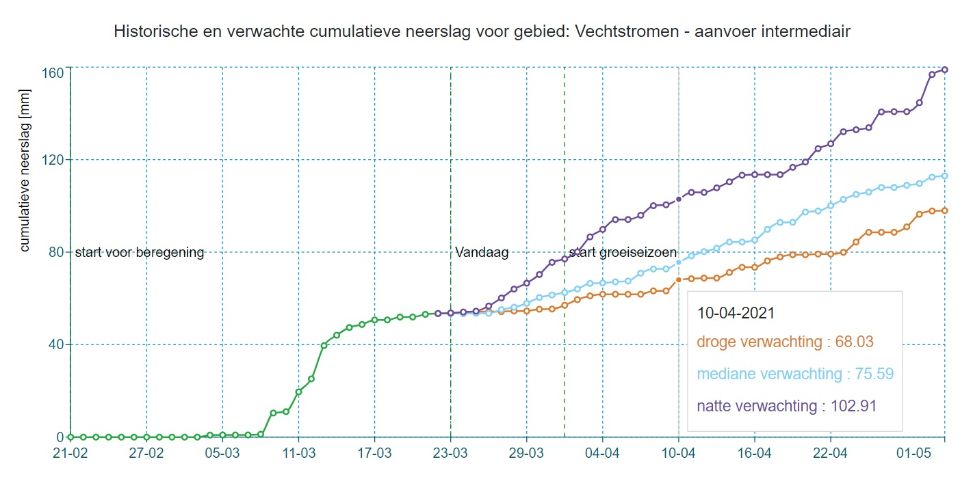
Using expected levels of precipitation and evaporation, the tool forecasts (up to six weeks in advance) the fresh water demand on surface water. In the event of an impending water shortage, the tool provides factual information regarding the water demand from industry, for irrigation, and so on. These functions compete for priority during a shortage, with choices needing to be made in regional drought meetings. The tool allows these interests to be weighed up in decisions on water distribution and measures.
Using this tool, measures can be implemented on the basis of a forecast. A range of possibilities is shown: if things do not turn out so bad, the result will be X; if they turn out worse, the result will be Y. The tool shows, therefore, what the consequences of a given decision will be.
Missed the webinar? Watch it back here.
Why the Water Demand Forecasting Tool

Easily anticipate
The tool forecasts fresh water demand up to six weeks in advance. This makes it easier to anticipate supply and demand.

Widely deployable
The Water Demand Forecasting Tool is deployable at any location where there is fresh water scarcity, be it regular or occasional in nature.

Clarity surrounding measures
Measures can be implemented on the basis of a forecast. The effects of the measure are immediately visible in the tool. This provides an indication of whether implementing the measures would be worthwhile.

More information?

Arie leverages his knowledge and experience for a sustainable and climate-adaptive living environment.
