Water quality roadmap
The Water Quality Roadmap gives water managers insight into causes of water quality problems in freshwater. After the required information is entered by the user, the tool provides possible measures to improve water quality at the specific location.
Use the roadmap here (NL)
Water quality is under pressure
Freshwater water quality in the Netherlands is under pressure. Especially due to climate change, agricultural intensification, chemical pollution and urbanisation. It is important that our fresh waters such as ponds, lakes and ditches become healthy and clean again. That is why it is important that in addition to specialists, municipalities and water boards also have knowledge that already provides direction and an initial indication.
The Water Quality Roadmap tool helps to gain insight into possible measures to improve water quality and is a first step to tackle the problems. The tool is intended for water managers. The Water Quality Roadmap was developed by Witteveen+Bos on behalf of STOWA .
How does the Water Quality Roadmap work?
The Water Quality Roadmap tool is online accessible to everyone, whether on a mobile device or on a computer or laptop. It is only available in Dutch. All questions and answers come with textual explanations, and the answer options are often visually represented in the form of images. In this way, we make the user wiser and share our knowledge with the water manager. The measures recommended at the end are written out and divided into four different categories. To arrive at those measures, several steps have to be gone through.
The steps of the tool
When you go to the website, you go through a few steps to arrive at adequate measures.
- Location and observation: Choose the exact location of the chosen water, the type of water and indicate what situation/problem is observed. Think of blue-green algae, dead fish or duckweed.
- Consideration: Indicate here whether the severity of the situation warrants taking (technical) measures. Consider the duration of the situation versus societal desires and goals.
- Analysis: This step provides insight into the possible causes of the situation.
- Measures: Based on the location, observation, consideration and analysis, measures are recommended. Examples include modifying the layout, adjusting the slope of the banks or reducing sewage discharges to the water.
Outcome of the Water Quality Roadmap: measures
After conducting the test, a list of possible measures is generated. This rough list forms an initial frame of mind towards improving water quality. We recommend working with a water quality expert to take a closer look at these measures and shape them in detail. Different types of measures are distinguished:
- Source measures: these measures aim to ensure that as few nutrients as possible enter the water from the environment. If too many nutrients enter the water, strong growth of algae often occurs. This makes the water too turbid for species that are desirable in the system, such as aquatic plants and certain fish species. Examples of source measures include preventing discharges of nutrient-rich water, or ensuring dog poo-free zones along the water.
- System measures: implementing these measures makes the water system more robust, making it more resilient. The water body is less likely to turn into a turbid state with algae. This can be done, for instance, by making the water shallower, allowing aquatic plants to get more light, grow better and purify the water.
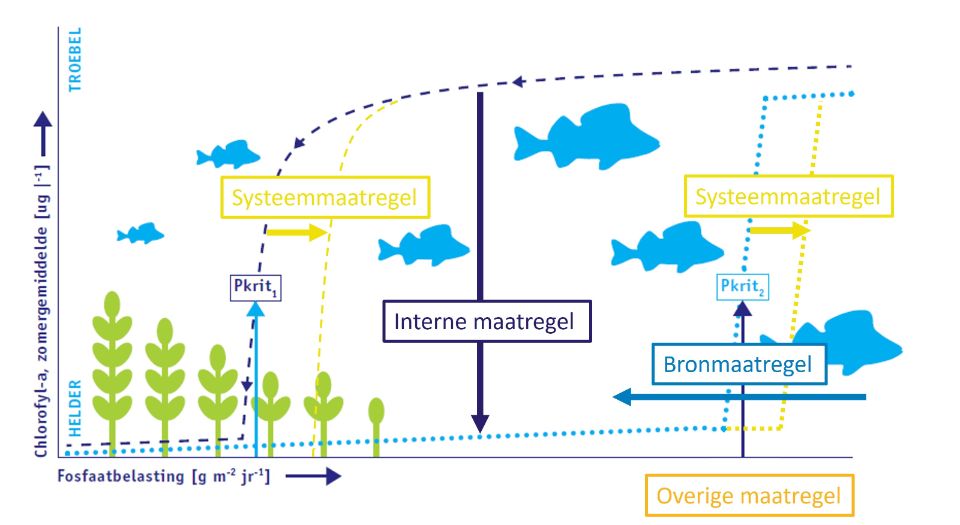
- Internal measures: if source and system measures have been implemented but the water is still turbid then internal measures can be implemented to give the water system a final push towards a clear state. This can be done, for example, by catching certain fish that stir up the bottom and thus keep the water turbid.
- Other measures: these measures are mainly related to the use of the water. People often recreate near the water, for example by boating, swimming or fishing, while this does not always go well with obtaining and maintaining good water quality. Restricting recreation in certain areas or periods could be considered, for example.
The measures that are expected to be most effective are listed first.
More information?
If you need a more in-depth analysis: check out PCLake and PCDitch. Want to know more and contact a water quality expert? Then contact us below.
Why the Water Quality Roadmap?

Quick insight
The tool helps water managers get a quick insight into possible measures to improve water quality, making it a first step towards addressing the problems.

Contributes to good water quality
Water quality in freshwater in the Netherlands is under pressure. The tool provides measures that help improve water quality.

Accessible and understandable
All questions and answers come with textual explanations, and the answer options are often visually represented in the form of images.

Want to know more?

Marloes has specialised in aquatic ecology and water quality of fresh, brackish and saline systems with a special interest in the effects of climate change and human actions.
